Practical work: Transformation of graphs of functions. Derivative The geometric meaning of the derivative
The derivative of a function $y = f(x)$ at a given point $х_0$ is the limit of the ratio of the increment of the function to the corresponding increment of its argument, provided that the latter tends to zero:
$f"(x_0)=(lim)↙(△x→0)(△f(x_0))/(△x)$
Differentiation is the operation of finding a derivative.
Table of derivatives of some elementary functions
| Function | Derivative |
| $c$ | $0$ |
| $x$ | $1$ |
| $x^n$ | $nx^(n-1)$ |
| $(1)/(x)$ | $-(1)/(x^2)$ |
| $√x$ | $(1)/(2√x)$ |
| $e^x$ | $e^x$ |
| $lnx$ | $(1)/(x)$ |
| $sinx$ | $cosx$ |
| $cosx$ | $-sinx$ |
| $tgx$ | $(1)/(cos^2x)$ |
| $ctgx$ | $-(1)/(sin^2x)$ |
Basic rules of differentiation
1. The derivative of the sum (difference) is equal to the sum (difference) of derivatives
$(f(x) ± g(x))"= f"(x)±g"(x)$
Find the derivative of the function $f(x)=3x^5-cosx+(1)/(x)$
The derivative of the sum (difference) is equal to the sum (difference) of the derivatives.
$f"(x) = (3x^5)"-(cos x)" + ((1)/(x))" = 15x^4 + sinx - (1)/(x^2)$
2. Derivative of a product
$(f(x) g(x))"= f"(x) g(x)+ f(x) g(x)"$
Find the derivative $f(x)=4x cosx$
$f"(x)=(4x)" cosx+4x (cosx)"=4 cosx-4x sinx$
3. Derivative of the quotient
$((f(x))/(g(x)))"=(f"(x) g(x)-f(x) g(x)")/(g^2(x)) $
Find the derivative $f(x)=(5x^5)/(e^x)$
$f"(x)=((5x^5)" e^x-5x^5 (e^x)")/((e^x)^2)=(25x^4 e^x- 5x^5 e^x)/((e^x)^2)$
4. The derivative of a complex function is equal to the product of the derivative of the external function and the derivative of the internal function
$f(g(x))"=f"(g(x)) g"(x)$
$f"(x)=cos"(5x) (5x)"=-sin(5x) 5= -5sin(5x)$
The physical meaning of the derivative
If a material point moves in a straight line and its coordinate changes depending on time according to the law $x(t)$, then the instantaneous speed of this point is equal to the derivative of the function.
The point moves along the coordinate line according to the law $x(t)= 1.5t^2-3t + 7$, where $x(t)$ is the coordinate at time $t$. At what point in time will the speed of the point be equal to $12$?
1. Speed is a derivative of $x(t)$, so let's find the derivative of the given function
$v(t) = x"(t) = 1.5 2t -3 = 3t -3$
2. To find at what point in time $t$ the speed was equal to $12$, we compose and solve the equation:
The geometric meaning of the derivative
Recall that the equation of a straight line not parallel to the coordinate axes can be written as $y = kx + b$, where $k$ is the slope of the straight line. The coefficient $k$ is equal to the tangent of the slope between the straight line and the positive direction of the $Ox$ axis.
The derivative of the function $f(x)$ at the point $x_0$ is equal to the slope $k$ of the tangent to the graph at the given point:
Therefore, we can make a general equality:
$f"(x_0) = k = tgα$
In the figure, the tangent to the function $f(x)$ is increasing, hence the coefficient $k > 0$. Since $k > 0$, then $f"(x_0) = tgα > 0$. The angle $α$ between the tangent and the positive direction $Ox$ is acute.
In the figure, the tangent to the function $f(x)$ is decreasing, hence the coefficient $k< 0$, следовательно, $f"(x_0) = tgα < 0$. Угол $α$ между касательной и положительным направлением оси $Ох$ тупой.
In the figure, the tangent to the function $f(x)$ is parallel to the $Ох$ axis, hence the coefficient $k = 0$, hence $f"(x_0) = tg α = 0$. The point $x_0$ at which $f "(x_0) = 0$, called extremum.
The figure shows the graph of the function $y=f(x)$ and the tangent to this graph drawn at the point with the abscissa $x_0$. Find the value of the derivative of the function $f(x)$ at the point $x_0$.
The tangent to the graph increases, therefore, $f"(x_0) = tg α > 0$
In order to find $f"(x_0)$, we find the tangent of the slope between the tangent and the positive direction of the $Ox$ axis. To do this, we complete the tangent to the triangle $ABC$.
Find the tangent of the angle $BAC$. (The tangent of an acute angle in a right triangle is the ratio of the opposite leg to the adjacent leg.)
$tg BAC = (BC)/(AC) = (3)/(12)= (1)/(4)=0.25$
$f"(x_0) = tg YOU = $0.25
Answer: $0.25
The derivative is also used to find the intervals of increasing and decreasing functions:
If $f"(x) > 0$ on an interval, then the function $f(x)$ is increasing on this interval.
If $f"(x)< 0$ на промежутке, то функция $f(x)$ убывает на этом промежутке.
The figure shows the graph of the function $y = f(x)$. Find among the points $х_1,х_2,х_3…х_7$ those points where the derivative of the function is negative.
In response, write down the number of data points.
In task No. 13 of the Unified State Examination in mathematics at the basic level, you will have to demonstrate the skills and knowledge of one of the concepts of the behavior of a function: derivatives at a point or rates of increase or decrease. The theory for this task will be added a little later, but this will not prevent us from analyzing several typical options in detail.
Analysis of typical options for tasks No. 14 USE in mathematics of a basic level
Option 14MB1
The graph shows the dependence of temperature on time in the process of warming up the engine of a car. The horizontal axis indicates the time in minutes that has elapsed since the engine was started; on the vertical axis is the engine temperature in degrees Celsius.

Using the graph, match each time interval with the characteristics of the engine warm-up process at this interval.
In the table, under each letter, indicate the corresponding number.
Execution algorithm:
- Select the time interval in which the temperature dropped.
- Attach a ruler to 30°C and determine the time interval at which the temperature was below 30°C.
Solution:
Let us choose the time interval in which the temperature dropped. This section is visible to the naked eye, it begins 8 minutes from the moment the engine is started.
Apply a ruler to 30°C and determine the time interval at which the temperature was below 30°C.

Below the ruler there will be a section corresponding to the time interval 0 - 1 min.
With the help of a pencil and a ruler, we find at what time interval the temperature was in the range from 40 ° C to 80 ° C.
From the points corresponding to 40°C and 80°C we drop the perpendiculars onto the graph, and from the obtained points we drop the perpendiculars onto the time axis.

We see that this temperature interval corresponds to a time interval of 3 - 6.5 min. That is, from those given in the condition 3 - 6 min.
Select the missing answer using the elimination method.
Option 14MB2
Solution:
Let's analyze the graph of function A. If the function increases, then the derivative is positive and vice versa. The derivative of the function is equal to zero at the extremum points.
First, the function A increases, i.e. the derivative is positive. This corresponds to the graphs of derivatives 2 and 3. At the maximum point of the function x = -2, that is, at this point, the derivative should be equal to zero. This condition corresponds to the graph number 3.
First, function B decreases, i.e. the derivative is negative. This corresponds to the graphs of derivatives 1 and 4. The maximum point of the function x \u003d -2, that is, at this point the derivative should be equal to zero. This condition corresponds to the graph number 4.
First, the function B increases, i.e. the derivative is positive. This corresponds to the graphs of derivatives 2 and 3. The maximum point of the function x = 1, that is, at this point, the derivative should be equal to zero. This condition corresponds to the graph number 2.
By the method of elimination, we can determine that the graph of the function Г corresponds to the graph of the derivative at number 1.
Answer: 3421.
Option 14MB3
The execution algorithm for each of the functions:
- Determine the intervals of increasing and decreasing functions.
- Determine the maximum and minimum points of the functions.
- Draw conclusions, match the proposed schedules.
Solution:
Let's analyze the graph of function A.
If the function is increasing, then the derivative is positive and vice versa. The derivative of the function is equal to zero at the extremum points.
The extremum point is the point at which the maximum or minimum value of the function is reached.
First, the function A increases, i.e. the derivative is positive. This corresponds to the graphs of derivatives 3 and 4. At the maximum point of the function x=0, that is, at this point, the derivative should be equal to zero. This condition corresponds to the graph number 4.
Let's analyze the graph of function B.
First, function B decreases, i.e. the derivative is negative. This corresponds to the graphs of derivatives 1 and 2. The minimum point of the function x=-1, that is, at this point the derivative must be equal to zero. This condition corresponds to the graph number 2.
Let's analyze the graph of the function B.
First, the function B decreases, i.e. the derivative is negative. This corresponds to the graphs of derivatives 1 and 2. The minimum point of the function x \u003d 0, that is, at this point the derivative should be equal to zero. This condition corresponds to the graph number 1.
By the method of elimination, we can determine that the graph of the function Г corresponds to the graph of the derivative at number 3.
Answer: 4213.
Option 14MB4
The figure shows a graph of a function and tangents drawn to it at points with abscissas A, B, C and D.The right column shows the values of the derivative at points A, B, C and D. Using the graph, match each point with the value of the derivative of the function at it.

POINTS
BUT
AT
FROM
D
DERIVATIVE VALUES
1) –4
2) 3
3) 2/3
4) -1/2
Recall what the derivative means, namely its value at the point - the value of the derivative function at a point is equal to the tangent of the slope (coefficient) of the tangent.
In the answers we have two positive and two negative options. As we remember, if the coefficient is direct (graphics y = kx + b) is positive, then the line is increasing; if it is negative, then the line is decreasing.
We have two ascending lines - at the point A and D. Now let's remember what does the value of the coefficient k mean?
The coefficient k shows how fast the function increases or decreases (in fact, the coefficient k itself is the derivative of the function y = kx + b).
Therefore, k \u003d 2/3 corresponds to a more gentle straight line - D, and k \u003d 3 - A.
Similarly, in the case of negative values: point B corresponds to a steeper straight line with k = -4, and point C - -1/2.
Option 14MB5
In the figure, the dots show the volume of monthly sales of heaters in a household appliance store. Months are indicated horizontally, the number of heaters sold is indicated vertically. For clarity, the points are connected by a line.

Using the figure, match each of the indicated time periods with the characteristics of sales of heaters.

Execution algorithm
We analyze the parts of the graph corresponding to different seasons. We formulate the situations displayed on the graph. We find the most suitable answers for them.
Solution:
In winter, the number of sales exceeded 120 pieces / month, and it has been increasing all the time. This situation corresponds to answer 3. Those. we get: A-3.
In the spring, sales gradually fell from 120 heaters per month to 50. Option No. 2 is closest to this formulation. We have: B–2.
In the summer, the number of sales did not change and was minimal. The 2nd part of this wording is not reflected in the answers, and only No. 4 is suitable for the first. Hence we have: AT 4.
In the fall, sales grew, but their number did not exceed 100 pieces in any of the months. This situation is described in option #1. We get: G–1.
Option 14MB6
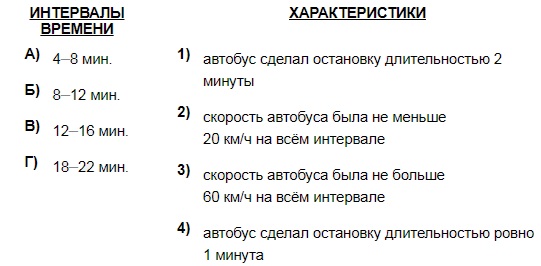
The graph shows the dependence of the speed of a regular bus on time. The vertical axis shows the speed of the bus in km/h, the horizontal axis shows the time in minutes since the start of the bus.

Using the graph, match each time interval with the characteristic of the bus movement at this interval.
Execution algorithm
- We determine the division price on the horizontal and vertical scales.
- We analyze in turn the proposed statements 1–4 from the right column (“Characteristics”). We compare them with time intervals from the left column of the table, we find pairs of "letter-number" for the answer.
Solution:
The division value of the horizontal scale is 1 s, the vertical scale is 20 km/h.
- When the bus stops, its speed is 0. For 2 minutes in a row, the bus had zero speed only from the 9th to the 11th minute. This time falls within the interval of 8–12 min. So we have a couple for the answer: B–1.
- The bus had a speed of 20 km/h or more for several time periods. Moreover, option A is not suitable here, because, for example, at the 7th minute the speed was 60 km / h, option B - because it has already been applied, option D - because at the beginning and end of the interval the bus had zero speed . In this case, option B is suitable (12–16 minutes); at this interval, the bus starts moving at a speed of 40 km/h, then accelerates to 100 km/m and then gradually reduces the speed to 20 km/h. So we have: IN 2.
- This is where the speed limit is set. We do not consider options B and C. The remaining intervals A and G are both suitable. Therefore, it would be correct to consider first the 4th option, and then return to the 3rd one again.
- Of the two remaining intervals, only 4–8 minutes are suitable for characteristic No. 4, since there was a stop at this interval (at the 6th minute). There were no stops during the interval of 18–22 minutes. We get: A-4. It follows from this that for characteristic No. 3 it is necessary to take the interval Г, i.e. it turns out a couple G–3.
Option 14MB7
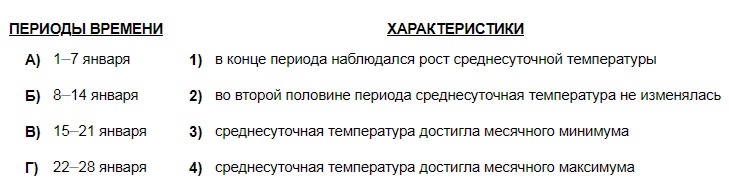
The dotted figure shows China's population growth from 2004 to 2013. The year is indicated horizontally, the population growth as a percentage (an increase in the population relative to the previous year) is indicated vertically. For clarity, the points are connected by a line.
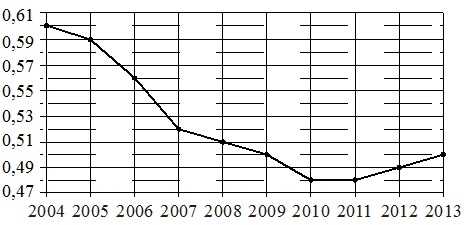
Using the diagram, match each of the indicated time periods with a characteristic of China's population growth during this period..
Execution algorithm
- Determine the value of division of the vertical scale of the picture. It is found as the difference between a pair of adjacent scale values divided by 2 (because there are 2 divisions between two adjacent values).
- We analyze the characteristics 1–4 sequentially given in the condition (left tabular column). We compare each of them with a specific period of time (right table column).
Solution:
The division value of the vertical scale is 0.01%.
- Growth decline continued continuously from 2004 to 2010. In 2010-2011, the increase was consistently minimal, and starting from 2012, it began to increase. Those. Growth stopped in 2010. This year is in the period 2009-2011. Accordingly, we have: IN 1.
- The largest drop in growth should be considered the most “steeply” falling line of the graph in the figure. It falls on the period 2006-2007. and is 0.04% per year (0.59–0.56=0.04% in 2006 and 0.56–0.52=0.04% in 2007). From here we get: A-2.
- The growth indicated in characteristic No. 3 began in 2007, continued in 2008 and ended in 2009. This corresponds to time period B, i.e. we have: B–3.
- Population growth began to increase after 2011, i.e. in 2012–2013 Therefore we get: G–4.
Option 14MB8
The figure shows a function graph and tangents drawn to it at points with abscissas A, B, C and D.

The right column shows the values of the derivative of the function at points A, B, C and D. Using the graph, match each point with the value of the derivative of the function at it.

Execution algorithm
- We consider a pair of tangents that have an acute angle with the positive direction of the x-axis. We compare them, find a match among the pair of corresponding values of the derivatives.
- We consider a pair of tangents forming an obtuse angle with the positive direction of the x-axis. We compare them modulo, we determine the correspondence to their values of derivatives among the two remaining in the right column.
Solution:
An acute angle with a positive direction of the x-axis is formed by derivatives in t.B and t.C. These derivatives have positive values. Therefore, one should choose here between the values \u200b\u200bNo. 1 and 3. Applying the rule that if the angle is less than 45 0, then the derivative is less than 1, and if more, then more than 1, we conclude: in t.B, the modulo derivative is greater than 1, in t.C - less than 1. This means that you can make pairs for the answer: AT 3 and S-1.
The derivatives in t.A and t.D form an obtuse angle with the positive direction of the x-axis. And here we apply the same rule, slightly paraphrasing it: the more the tangent at the point is “pressed” to the line of the abscissa axis (to its negative direction), the greater it is in absolute value. Then we get: the derivative at point A is less in absolute value than the derivative at point D. From here we have pairs for the answer: A-2 and D-4.
Option 14MB9
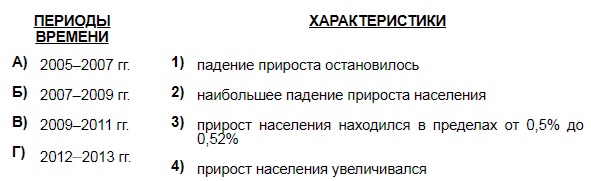
Dots in the figure show the average daily air temperature in Moscow in January 2011. Dates of the month are indicated horizontally, temperatures in degrees Celsius are indicated vertically. For clarity, the points are connected by a line.

Using the figure, match each of the indicated time periods with a characteristic of temperature change.
Execution algorithm
We analyze sequentially characteristics 1–4 (right column), using the graph in the figure. We put each of them in line with a specific time period (left column).
Solution:
- An increase in temperature was observed only at the end of the period on January 22–28. Here, on the 27th and 28th, it increased by 1 and 2 degrees, respectively. At the end of the period on January 1–7, the temperature was stable (–10 degrees), at the end of January 8–14 and 15–21 it dropped (from –1 to –2 and from –11 to –12 degrees, respectively). Therefore we get: G–1.
- Since each time period covers 7 days, the temperature should be analyzed starting from the 4th day of each period. The temperature remained unchanged for 3–4 days only from 4 to 7 January. So we get the answer: A-2.
- The monthly minimum temperature was observed on January 17. This number falls within the period January 15–21. From here we have a couple: AT 3.
- The temperature maximum fell on January 10 and amounted to +1 degree. This date falls within the period of January 8–14. So we have: B-4.
Option 14MB10
Execution algorithm
- The function value at a point is positive if this point is located above the Ox axis.
- The derivative at a point is greater than zero if the tangent to that point forms an acute angle with the positive direction of the x-axis.
Solution:
Point A. It is below the Ox axis, which means the value of the function in it is negative. If we draw a tangent in it, then the angle between it and the positive direction Ox will be about 90 0, i.e. forms an acute angle. So, in this case, characteristic number 3 is suitable. Those. we have: A-3.
Point B. It is located above the Ox axis, i.e. the point has a positive function value. The tangent at this point will be quite close to the abscissa axis, forming an obtuse angle (slightly less than 180 0) with its positive direction. Accordingly, the derivative at this point is negative. Thus, characteristic 1 is suitable here. We get the answer: IN 1.
Point C. The point is located below the Ox axis, the tangent in it forms a large obtuse angle with the positive direction of the abscissa axis. Those. in t.C, the value of both the function and the derivative is negative, which corresponds to characteristic No. 2. Answer: S-2.
Point D. The point is located above the Ox axis, and the tangent in it forms an acute angle with the positive direction of the axis. This suggests that both the value of the function and the value of the derivative are greater than zero here. Answer: D-4.
Option 14MB11
In the figure, the dots show the volume of monthly sales of refrigerators in a household appliance store. Months are indicated horizontally, the number of refrigerators sold is indicated vertically. For clarity, the points are connected by a line.

Using the figure, match each of the indicated time periods with the characteristics of sales of refrigerators.
The line y=3x+2 is tangent to the graph of the function y=-12x^2+bx-10. Find b , given that the abscissa of the touch point is less than zero.
Show SolutionSolution
Let x_0 be the abscissa of the point on the graph of the function y=-12x^2+bx-10 through which the tangent to this graph passes.
The value of the derivative at the point x_0 is equal to the slope of the tangent, i.e. y"(x_0)=-24x_0+b=3. On the other hand, the tangent point belongs to both the graph of the function and the tangent, i.e. -12x_0^2+bx_0-10= 3x_0 + 2. We get a system of equations \begin(cases) -24x_0+b=3,\\-12x_0^2+bx_0-10=3x_0+2. \end(cases)
Solving this system, we get x_0^2=1, which means either x_0=-1 or x_0=1. According to the condition of the abscissa, the touch points are less than zero, therefore x_0=-1, then b=3+24x_0=-21.
Answer
Condition
The figure shows a graph of the function y=f(x) (which is a broken line made up of three straight line segments). Using the figure, compute F(9)-F(5), where F(x) is one of the antiderivatives of f(x).
Show SolutionSolution
According to the Newton-Leibniz formula, the difference F(9)-F(5), where F(x) is one of the antiderivatives of the function f(x), is equal to the area of the curvilinear trapezoid bounded by the graph of the function y=f(x), straight lines y=0 , x=9 and x=5. According to the graph, we determine that the specified curvilinear trapezoid is a trapezoid with bases equal to 4 and 3 and a height of 3.
Its area is equal to \frac(4+3)(2)\cdot 3=10.5.
Answer
Source: "Mathematics. Preparation for the exam-2017. profile level. Ed. F. F. Lysenko, S. Yu. Kulabukhova.
Condition
The figure shows a graph of y \u003d f "(x) - the derivative of the function f (x), defined on the interval (-4; 10). Find the intervals of decreasing function f (x). In your answer, indicate the length of the largest of them.

Solution
As you know, the function f (x) decreases on those intervals, at each point of which the derivative f "(x) is less than zero. Considering that it is necessary to find the length of the largest of them, three such intervals are naturally distinguished from the figure: (-4; -2) ;(0;3);(5;9).
The length of the largest of them - (5; 9) is equal to 4.
Answer
Source: "Mathematics. Preparation for the exam-2017. profile level. Ed. F. F. Lysenko, S. Yu. Kulabukhova.
Condition
The figure shows a graph of y \u003d f "(x) - the derivative of the function f (x), defined on the interval (-8; 7). Find the number of maximum points of the function f (x) belonging to the interval [-6; -2].
.png)
Solution
The graph shows that the derivative f "(x) of the function f (x) changes sign from plus to minus (there will be a maximum at such points) at exactly one point (between -5 and -4) from the interval [-6; -2 Therefore, there is exactly one maximum point on the interval [-6;-2].
Answer
Source: "Mathematics. Preparation for the exam-2017. profile level. Ed. F. F. Lysenko, S. Yu. Kulabukhova.
Condition
The figure shows a graph of the function y=f(x) defined on the interval (-2; 8). Determine the number of points where the derivative of the function f(x) is equal to 0 .

Solution
If the derivative at a point is equal to zero, then the tangent to the graph of the function drawn at this point is parallel to the Ox axis. Therefore, we find such points at which the tangent to the function graph is parallel to the Ox axis. On this chart, such points are extremum points (maximum or minimum points). As you can see, there are 5 extremum points.
Answer
Source: "Mathematics. Preparation for the exam-2017. profile level. Ed. F. F. Lysenko, S. Yu. Kulabukhova.
Condition
The line y=-3x+4 is parallel to the tangent to the graph of the function y=-x^2+5x-7. Find the abscissa of the point of contact.
Show SolutionSolution
The slope of the line to the graph of the function y=-x^2+5x-7 at an arbitrary point x_0 is y"(x_0). But y"=-2x+5, so y"(x_0)=-2x_0+5. Angular the coefficient of the line y=-3x+4 specified in the condition is -3.Parallel lines have the same slopes.Therefore, we find such a value x_0 that =-2x_0 +5=-3.
We get: x_0 = 4.
Answer
Source: "Mathematics. Preparation for the exam-2017. profile level. Ed. F. F. Lysenko, S. Yu. Kulabukhova.
Condition
The figure shows a graph of the function y=f(x) and marked points -6, -1, 1, 4 on the x-axis. At which of these points is the value of the derivative the smallest? Please indicate this point in your answer.


 Back forward
Attention! The slide preview is for informational purposes only and may not represent the full extent of the presentation. If you are interested in this work, please download the full version.
Lesson type: repetition and generalization.
Lesson form: consultation lesson.
Lesson Objectives:
- educational: repeat and generalize theoretical knowledge on the topics: “Geometric meaning of the derivative” and “Application of the derivative to the study of functions”; consider all types of B8 tasks encountered in the exam in mathematics; provide students with the opportunity to test their knowledge by independently solving problems; teach how to fill in the examination form of answers;
- developing: to promote the development of communication as a method of scientific knowledge, semantic memory and voluntary attention; the formation of such key competencies as comparison, comparison, classification of objects, determination of adequate ways to solve a learning problem based on given algorithms, the ability to act independently in a situation of uncertainty, control and evaluate one’s activities, find and eliminate the causes of difficulties that have arisen;
- educational: develop students' communicative competencies (culture of communication, ability to work in groups); contribute to the development of the need for self-education.
Technologies: developmental education, ICT.
Teaching methods: verbal, visual, practical, problematic.
Forms of work: individual, frontal, group.
Educational and methodological support:
1. Algebra and the beginning of mathematical analysis. Grade 11: textbook. For general education Institutions: basic and profile. levels / (Yu. M. Kolyagin, M.V. Tkacheva, N. E. Fedorova, M. I. Shabunin); edited by A. B. Zhizhchenko. - 4th ed. - M .: Education, 2011.
2. USE: 3000 tasks with answers in mathematics. All tasks of group B / A.L. Semyonov, I.V. Yashchenko and others; edited by A.L. Semyonova, I.V. Yashchenko. - M .: Publishing house "Exam", 2011.
3. Open job bank.
Equipment and materials for the lesson: a projector, a screen, a PC for each student with a presentation installed on it, a printout of a memo for all students (Attachment 1) and score sheet Appendix 2) .
Preliminary preparation for the lesson: as a homework, students are invited to repeat the textbook theoretical material on the topics: “The geometric meaning of the derivative”, “Application of the derivative to the study of functions”; the class is divided into groups (4 people each), each of which has students of different levels.
Explanation for the lesson: This lesson is held in grade 11 at the stage of repetition and preparation for the exam. The lesson is aimed at repetition and generalization of theoretical material, its application in solving examination problems. Lesson duration - 1.5 hours .
This lesson is not attached to the textbook, so it can be carried out while working on any teaching materials. Also, this lesson can be divided into two separate ones and held as final lessons on the topics under consideration.
During the classes
I. Organizational moment.
II. Goal setting lesson.
III. Repetition on the topic “Geometric meaning of the derivative”.
Oral frontal work using a projector (slides No. 3-7)
Group work: problem solving with hints, answers, with teacher's advice (slides No. 8-17)
IV. Independent work 1.
Students work individually on a PC (slides No. 18-26), their answers are entered in the evaluation sheet. If necessary, you can take the teacher's advice, but in this case the student will lose 0.5 points. If the student copes with the work earlier, then he can choose to solve additional tasks from the collection, pp. 242, 306-324 (additional tasks are evaluated separately).
V. Mutual verification.
Students exchange evaluation sheets, check the work of a friend, give points (slide No. 27)
VI. Knowledge correction.
VII. Repetition on the topic “Application of the derivative to the study of functions”
Oral frontal work using a projector (slides No. 28-30)
Group work: solving problems with prompts, answers, with teacher's advice (slides No. 31-33)
VIII. Independent work 2.
Students work individually on a PC (slides No. 34-46), enter their answers in the answer sheet. If necessary, you can take the teacher's advice, but in this case the student will lose 0.5 points. If the student copes with the work earlier, then he can choose to solve additional tasks from the collection, pp. 243-305 (additional tasks are evaluated separately).
IX. Mutual verification.
Students exchange evaluation sheets, check the work of a friend, give points (slide No. 47).
X. Correction of knowledge.
The students again work in their groups, discuss the solution, correct the mistakes.
XI. Summarizing.
Each student calculates their scores and puts a mark on the evaluation sheet.
The students hand over to the teacher the evaluation sheet and the solution of additional problems.
Each student receives a memo (slide No. 53-54).
XII. Reflection.
Students are asked to evaluate their knowledge by choosing one of the phrases:
- I got it all!!!
- We need to solve a couple more examples.
- Who came up with this math!
XIII. Homework.
For homework, students are invited to choose to solve tasks from the collection, pp. 242-334, as well as from an open bank of tasks.
First, try to find the scope of the function:
Did you manage? Let's compare the answers:
All right? Well done!
Now let's try to find the range of the function:

Found? Compare:
Did it agree? Well done!
Let's work with the graphs again, only now it's a little more difficult - to find both the domain of the function and the range of the function.
How to Find Both the Domain and Range of a Function (Advanced)

Here's what happened:
With graphics, I think you figured it out. Now let's try to find the domain of the function in accordance with the formulas (if you don't know how to do this, read the section about):
Did you manage? Checking answers:
- , since the root expression must be greater than or equal to zero.
- , since it is impossible to divide by zero and the radical expression cannot be negative.
- , since, respectively, for all.
- because you can't divide by zero.
However, we still have one more moment that has not been sorted out ...
Let me reiterate the definition and focus on it:
Noticed? The word "only" is a very, very important element of our definition. I will try to explain to you on the fingers.
Let's say we have a function given by a straight line. . When, we substitute this value into our "rule" and get that. One value corresponds to one value. We can even make a table of various values and plot a given function to verify this.
"Look! - you say, - "" meets twice!" So maybe the parabola is not a function? No, it is!
The fact that "" occurs twice is far from a reason to accuse the parabola of ambiguity!
The fact is that, when calculating for, we got one game. And when calculating with, we got one game. So that's right, the parabola is a function. Look at the chart:

Got it? If not, here's a real-life example for you, far from mathematics!
Let's say we have a group of applicants who met when submitting documents, each of whom told in a conversation where he lives:

Agree, it is quite realistic that several guys live in the same city, but it is impossible for one person to live in several cities at the same time. This is, as it were, a logical representation of our "parabola" - Several different x's correspond to the same y.
Now let's come up with an example where the dependency is not a function. Let's say these same guys told what specialties they applied for:

Here we have a completely different situation: one person can easily apply for one or several directions. That is one element sets are put in correspondence multiple elements sets. Respectively, it's not a function.
Let's test your knowledge in practice.
Determine from the pictures what is a function and what is not:

Got it? And here is answers:
- The function is - B,E.
- Not a function - A, B, D, D.
You ask why? Yes, here's why:

In all figures except AT) and E) there are several for one!
I am sure that now you can easily distinguish a function from a non-function, say what an argument is and what a dependent variable is, and also determine the scope of the argument and the scope of the function. Let's move on to the next section - how to define a function?
Ways to set a function
What do you think the words mean "set function"? That's right, it means explaining to everyone what function we are talking about in this case. Moreover, explain in such a way that everyone understands you correctly and the graphs of functions drawn by people according to your explanation were the same.
How can I do that? How to set a function? The easiest way, which has already been used more than once in this article - using a formula. We write a formula, and by substituting a value into it, we calculate the value. And as you remember, a formula is a law, a rule according to which it becomes clear to us and to another person how an X turns into a Y.
Usually, this is exactly what they do - in tasks we see ready-made functions defined by formulas, however, there are other ways to set a function that everyone forgets about, and therefore the question “how else can you set a function?” confuses. Let's take a look at everything in order, and start with the analytical method.
Analytical way of defining a function
The analytical method is the task of a function using a formula. This is the most universal and comprehensive and unambiguous way. If you have a formula, then you know absolutely everything about the function - you can make a table of values on it, you can build a graph, determine where the function increases and where it decreases, in general, explore it in full.
Let's consider a function. What does it matter?
"What does it mean?" - you ask. I'll explain now.
Let me remind you that in the notation, the expression in brackets is called the argument. And this argument can be any expression, not necessarily simple. Accordingly, whatever the argument (expression in brackets), we will write it instead in the expression.
In our example, it will look like this:
Consider another task related to the analytical method of specifying a function that you will have on the exam.
Find the value of the expression, at.
I'm sure that at first, you were scared when you saw such an expression, but there is absolutely nothing scary in it!
Everything is the same as in the previous example: whatever the argument (expression in brackets), we will write it instead in the expression. For example, for a function.
What should be done in our example? Instead, you need to write, and instead of -:
shorten the resulting expression:
That's all!
Independent work
Now try to find the meaning of the following expressions yourself:
- , if
- , if
Did you manage? Let's compare our answers: We are used to the fact that the function has the form
Even in our examples, we define the function in this way, but analytically it is possible to define the function implicitly, for example.
Try building this function yourself.
Did you manage?
Here's how I built it.
What equation did we end up with?
Correctly! Linear, which means that the graph will be a straight line. Let's make a table to determine which points belong to our line:
That's just what we were talking about ... One corresponds to several.
Let's try to draw what happened:

Is what we got a function?
That's right, no! Why? Try to answer this question with a picture. What did you get?

“Because one value corresponds to several values!”
What conclusion can we draw from this?
That's right, a function can't always be expressed explicitly, and what's "disguised" as a function isn't always a function!
Tabular way of defining a function
As the name suggests, this method is a simple plate. Yes Yes. Like the one we already made. For example:
Here you immediately noticed a pattern - Y is three times larger than X. And now the “think very well” task: do you think that a function given in the form of a table is equivalent to a function?
Let's not talk for a long time, but let's draw!
So. We draw a function given in both ways:

Do you see the difference? It's not about the marked points! Take a closer look:

Have you seen it now? When we set the function in a tabular way, we reflect on the graph only those points that we have in the table and the line (as in our case) passes only through them. When we define a function in an analytical way, we can take any points, and our function is not limited to them. Here is such a feature. Remember!
Graphical way to build a function
The graphical way of constructing a function is no less convenient. We draw our function, and another interested person can find what y is equal to at a certain x, and so on. Graphical and analytical methods are among the most common.
However, here you need to remember what we talked about at the very beginning - not every “squiggle” drawn in the coordinate system is a function! Remembered? Just in case, I'll copy here the definition of what a function is:
As a rule, people usually name exactly those three ways of specifying a function that we have analyzed - analytical (using a formula), tabular and graphic, completely forgetting that a function can be described verbally. Like this? Yes, very easy!
Verbal description of the function
How to describe the function verbally? Let's take our recent example - . This function can be described as "each real value of x corresponds to its triple value." That's all. Nothing complicated. Of course, you will object - “there are such complex functions that it is simply impossible to set verbally!” Yes, there are some, but there are functions that are easier to describe verbally than to set with a formula. For example: "each natural value of x corresponds to the difference between the digits of which it consists, while the largest digit contained in the number entry is taken as the minuend." Now consider how our verbal description of the function is implemented in practice:
The largest digit in a given number -, respectively, - is reduced, then:
Main types of functions
Now let's move on to the most interesting - we will consider the main types of functions with which you worked / work and will work in the course of school and institute mathematics, that is, we will get to know them, so to speak, and give them a brief description. Read more about each function in the corresponding section.
Linear function
A function of the form, where, are real numbers.
The graph of this function is a straight line, so the construction of a linear function is reduced to finding the coordinates of two points.
The position of the straight line on the coordinate plane depends on the slope.

Function scope (aka argument range) - .
The range of values is .
quadratic function
Function of the form, where
The graph of the function is a parabola, when the branches of the parabola are directed downwards, when - upwards.
Many properties of a quadratic function depend on the value of the discriminant. The discriminant is calculated by the formula
The position of the parabola on the coordinate plane relative to the value and coefficient is shown in the figure:

Domain
The range of values depends on the extremum of the given function (the vertex of the parabola) and the coefficient (the direction of the branches of the parabola)
Inverse proportionality
The function given by the formula, where
The number is called the inverse proportionality factor. Depending on what value, the branches of the hyperbola are in different squares:

Domain - .
The range of values is .
SUMMARY AND BASIC FORMULA
1. A function is a rule according to which each element of a set is assigned a unique element of the set.
- - this is a formula denoting a function, that is, the dependence of one variable on another;
- - variable, or argument;
- - dependent value - changes when the argument changes, that is, according to some specific formula that reflects the dependence of one value on another.
2. Valid argument values, or the scope of a function, is what is related to the possible under which the function makes sense.
3. Range of function values- this is what values it takes, with valid values.
4. There are 4 ways to set the function:
- analytical (using formulas);
- tabular;
- graphic
- verbal description.
5. Main types of functions:
- : , where, are real numbers;
- : , where;
- : , where.


